The Characteristics of Big Data: The 5 Vs and Beyond
Volume: The Scale of Data
Volume refers to the sheer amount of data generated and stored. In the big data era, organizations deal with terabytes, petabytes, or even exabytes of information, far exceeding the capacity of traditional systems.
Examples: A large e-commerce platform like Amazon handles petabytes of customer data, including purchase history, browsing behavior, and reviews. Similarly, the Large Hadron Collider generates 25 petabytes of particle collision data annually.
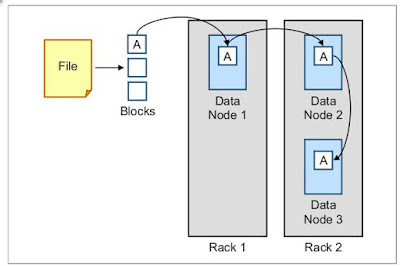
Interplay: High volume often necessitates distributed storage solutions like Hadoop Distributed File System (HDFS) and drives the need for parallel processing frameworks like Apache Spark.
Metrics: Measured in bytes (kilobytes to exabytes), with storage capacity (e.g., terabytes per node) and data growth rate (e.g., 20% annually) as key indicators.
Velocity: The Speed of Data
Velocity describes the speed at which data is generated, processed, and acted upon. Real-time or near-real-time data flows are a hallmark of big data, contrasting with the batch processing of the past.
Examples: Stock market trades are processed in microseconds, while Twitter streams deliver millions of tweets per day, requiring instant analysis for trends. IoT devices, like traffic sensors, send data every second to optimize city flow.
Interplay: High velocity demands stream processing tools like Apache Kafka and Flink, which complement high-volume storage systems to enable timely insights.
Metrics: Measured in data throughput (e.g., gigabytes per second), latency (e.g., milliseconds), and event frequency (e.g., events per minute).
Variety: The Diversity of Data
Variety highlights the range of data types and formats, from structured to unstructured and semi-structured. This diversity challenges traditional database designs that relied on uniform data.
Examples: A healthcare system might combine structured patient records with unstructured doctor notes and semi-structured wearable device logs. Social media includes text, images, and videos, all requiring different handling.
Interplay: Variety necessitates flexible storage (e.g., NoSQL databases like MongoDB) and advanced analytics to integrate disparate sources, influencing volume and velocity requirements.
Metrics: Assessed by data type distribution (e.g., 60% unstructured, 30% semi-structured, 10% structured) and schema complexity (e.g., number of fields per record).
Veracity: The Uncertainty of Data
Veracity addresses the accuracy, trustworthiness, and completeness of data. In big data, inconsistencies or noise can arise from multiple sources, impacting reliability.
Examples: Social media sentiment analysis might include sarcastic tweets, skewing results. Sensor data from IoT devices can be incomplete due to connectivity issues.
Interplay: Low veracity increases the need for data cleaning and validation, affecting velocity (delays in processing) and value (reduced insight quality).
Metrics: Measured by error rate (e.g., 5% missing values), data consistency score (e.g., 90% match across sources), and confidence intervals (e.g., 95% confidence).
Value: The Insight from Data
Value is the ultimate goal of big data—transforming raw data into actionable insights or competitive advantage. Not all data is valuable; the challenge lies in extracting meaning.
Examples: Netflix uses viewing data to recommend shows, adding value for users and revenue for the company. Retailers analyze purchase patterns to optimize stock, boosting profits.
Interplay: Value depends on effective handling of volume, velocity, variety, and veracity. Advanced analytics and machine learning amplify this potential.
Metrics: Evaluated by return on investment (ROI) from data projects (e.g., $10 million profit), insight accuracy (e.g., 85% predictive success), and adoption rate (e.g., 70% of decisions data-driven).
Beyond the 5 Vs: Emerging Characteristics
As big data evolves, additional Vs are emerging to reflect new challenges and opportunities:
Variability: Data flows can fluctuate in structure or meaning over time. For instance, social media hashtags may change context daily, requiring adaptive processing.
Visualization: The ability to represent complex data visually (e.g., dashboards, heatmaps) is critical for human interpretation. Tools like Tableau turn raw data into actionable visuals.
Interplay: Variability complicates veracity and velocity, while visualization enhances value by making insights accessible.
The Interplay of the Vs
The 5 Vs (and beyond) are interconnected. High volume increases the need for fast velocity and diverse variety, but poor veracity can diminish value. For example, a smart city collecting traffic data (high volume and velocity) must ensure sensor accuracy (veracity) to optimize traffic lights (value). This interplay drives the design of big data architectures, balancing trade-offs like speed vs. accuracy.
Measuring Big Data
To quantify these characteristics, organizations use specific metrics:
Volume: Total storage (e.g., 10 PB), growth rate (e.g., 25% yearly).
Velocity: Throughput (e.g., 500 GB/s), latency (e.g., 10 ms).
Variety: Type diversity (e.g., 50% unstructured), schema count (e.g., 200 fields).
Veracity: Error rate (e.g., 3%), consistency (e.g., 95%).
Value: ROI (e.g., $5M), insight adoption (e.g., 60%).
These metrics guide infrastructure decisions, from storage capacity to processing power, ensuring systems align with big data’s demands.
Why These Characteristics Matter
Understanding the 5 Vs and beyond is essential for navigating big data’s landscape. They define the challenges—scalability, speed, diversity—and the opportunities—insights, efficiency. This chapter’s principles will underpin the technical solutions and applications explored later, equipping you to tackle real-world big data scenarios.


Comments
Post a Comment